


Summary
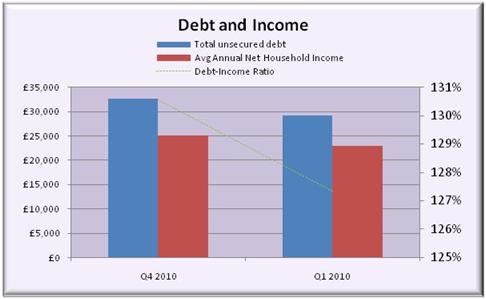
Debt and income
Figure 1.1 shows the average level of unsecured debt fell 10.4% from Q4 2009 to Q1 2010, whilst household income fell at a slower rate of 8% over the same period. As a result, debt-income ratio fell 2.5% from 1.31 to 1.27, which we’d expect to see over this period due to the ‘New Year resolution’ effect, where a higher proportion of callers with lower gearing contact the helpline to spring clean their finances.
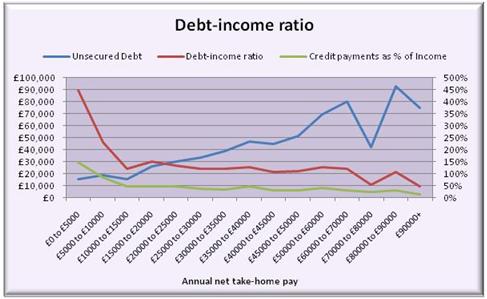
Debt-income ratio
Figure 1.2 shows, as we’d expect, that the average level of unsecured debt increases in line with net take home pay. The debt-income ratio however, diverges, running analogous with the % of income used to service credit debts. Not only do severely impoverished, low-income families find it more difficult to maintain spending on essential items (such as food, housing and travel) but they are also more exposed to future upward revisions in interest rates.
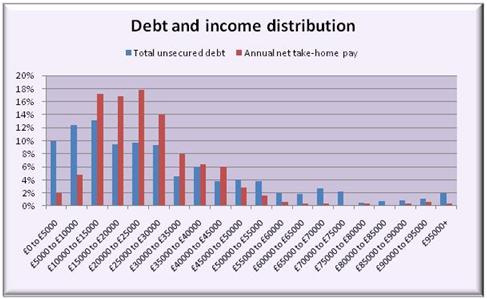
Debt and income distribution
Figure 1.3 shows that the majority of incomes are distributed between £10,000 and £25,000, whilst the majority of unsecured debts are less than £15,000. You can also see a disproportionately high distribution of debt (relative to income distribution) at the tails of the distribution (above £50,000 and below £15,000).
Latest Report
Subscribe
This form collects your name and email address so that we can email you our statistical updates.
Get in touch
For more information about Debt Advice Foundation's statistical releases:
Debt Advice Foundation
1 Anchor Court
Commercial Road
Darwen
BB3 0DB